A connected Growthmerce partnership across strategy, media, creative and operations. Clear ownership, reporting cadence and customer-care feedback turned daily operations into inputs for better marketing decisions.
Egyptian Clothing Brand Growth Case Study
A connected Growthmerce partnership across strategy, media, creative and operations. Clear ownership, reporting cadence and customer-care feedback turned daily operations into inputs for better marketing decisions.
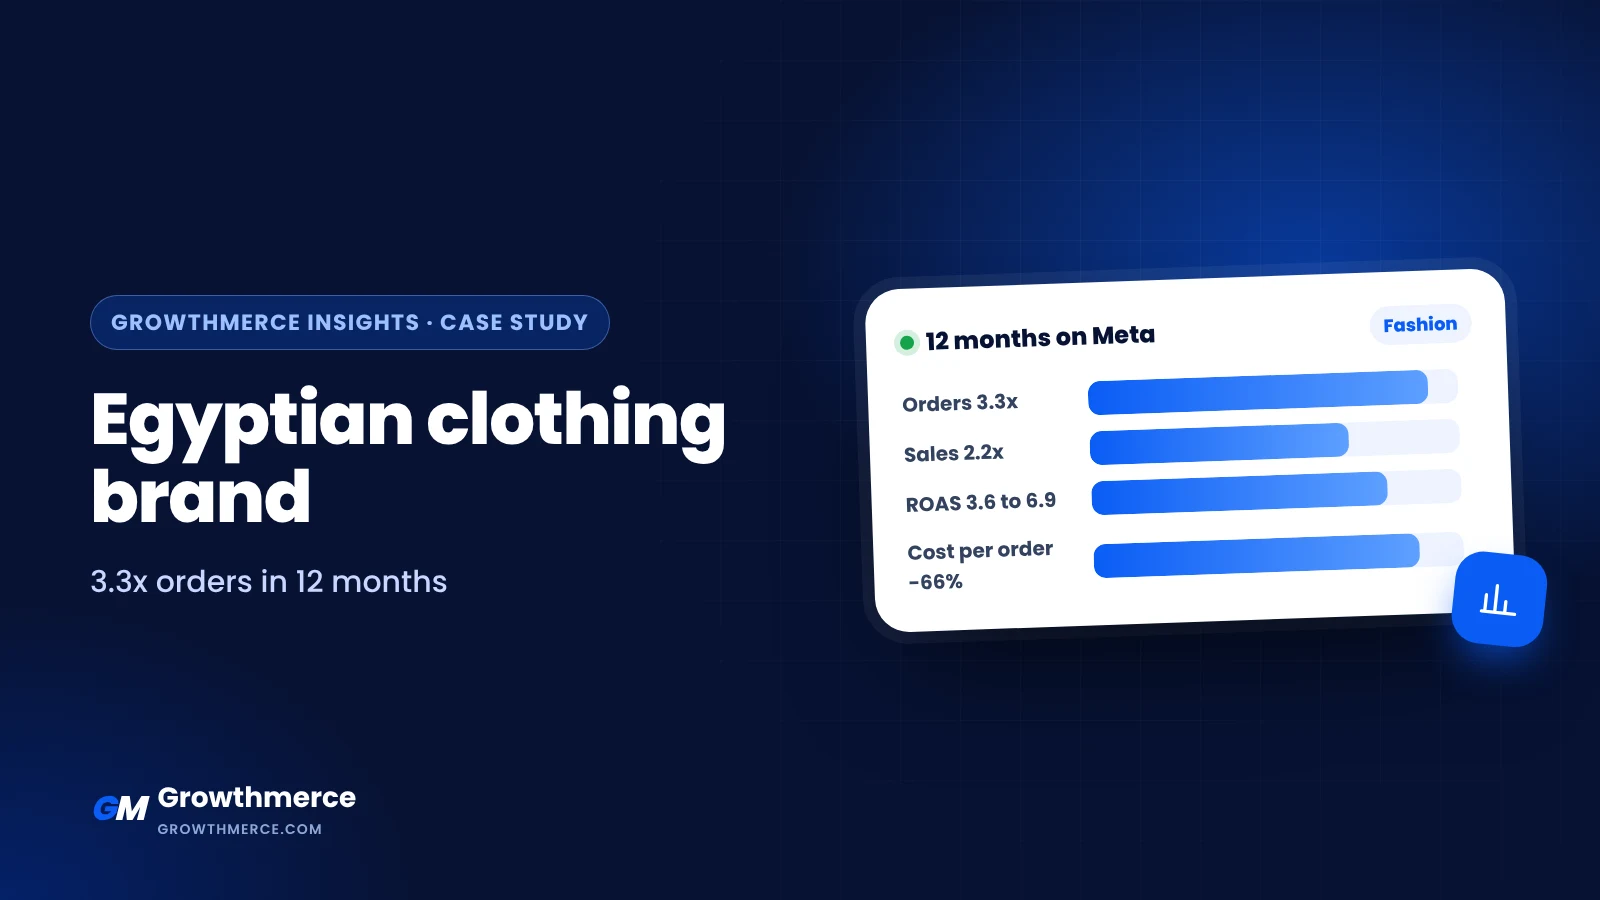
An Egyptian clothing brand was paying more for ads and selling less every month. Orders were down 70% from their peak. Shaher Rizk took over in November 2025, and twelve months later the brand was doing 8,222 orders a month at a third of the ad cost per order.
From the bottom to a record month
Nov 2024
Key months from Shopify. August and September 2025 averaged around 600 orders.
More spend, fewer orders, every month
From 2,218 orders in November 2024 to around 600 a month in August and September 2025.
Average EGP 559 in 2025, then EGP 920 in August and EGP 1,177 in September.
A very thin margin after ad spend for a clothing brand.
Cost per order in 2025
559 EGP
920 EGP
1,177 EGP
The ads were not the only problem
It was the product, the price and the images customers saw.
The price was high for the market
People clicked the ad but did not complete the order, so cost per order kept rising.
One creative style
Ads only listed product features, so the audience got tired of them fast.
Product photos hurt trust
Wrinkled pieces, sizes that did not sit right on the model and models that did not match the audience.
Manufacturing on guesswork
Styles were produced before knowing if the market wanted them. Some sat in the warehouse, others sold out.
Four decisions, one for each problem
Lower the price to earn more
We cut the price per piece by EGP 100. The ad cost per piece dropped by EGP 150.
+
=
Test styles before manufacturing
Instead of producing and hoping, new styles were tested with ads first. Only winners went into production, so stock went to what the market actually wanted.
Four creative directions instead of one
Each direction speaks to a different segment, so ads stayed fresh longer without the audience getting bored.
Fix the product photos
We used AI to fix wrinkles and how sizes sat on the model, and changed the models to suit the audience.
October 2026 vs October 2025
×11.8
×8
12 months before vs 12 months after
| Metric | Before | After | Change |
|---|---|---|---|
| Orders |
12,530
|
41,673
|
×3.3 |
| Sales (EGP) |
24.9M
|
55.6M
|
×2.2 |
| Ad cost per order (EGP) |
559
|
188
|
−66% |
| ROAS |
3.6
|
6.9
|
×1.9 |
| CPM (EGP) |
150
|
105
|
−30% |
Average order value fell from around EGP 1,990 to EGP 1,330. That is the pricing decision working: a lower price per piece, far more orders and more profit on every piece.
Where the numbers come from
Orders and sales: Shopify gross sales for both of the brand’s stores combined. “Before” is November 2024 to October 2025; “after” is November 2025 to October 2026.
Ad numbers: Meta Ads Manager, purchases reported by the pixel. “Before” is January to September 2025 from the previous ad account (no spend in July); “after” is November 2025 to 10 November 2026 from the current account.
 Who ran it
This account was managed end to end by Shaher: pricing decisions, style testing, creative direction and daily media buying on Meta.
- Pricing and margin decisions
- Style tests before production
- Four creative directions
- Daily Meta media buying