A connected Growthmerce partnership across strategy, media, creative and operations. Clear ownership, reporting cadence and customer-care feedback turned daily operations into inputs for better marketing decisions.
US Dropshipping Store Case Study
A connected Growthmerce partnership across strategy, media, creative and operations. Clear ownership, reporting cadence and customer-care feedback turned daily operations into inputs for better marketing decisions.
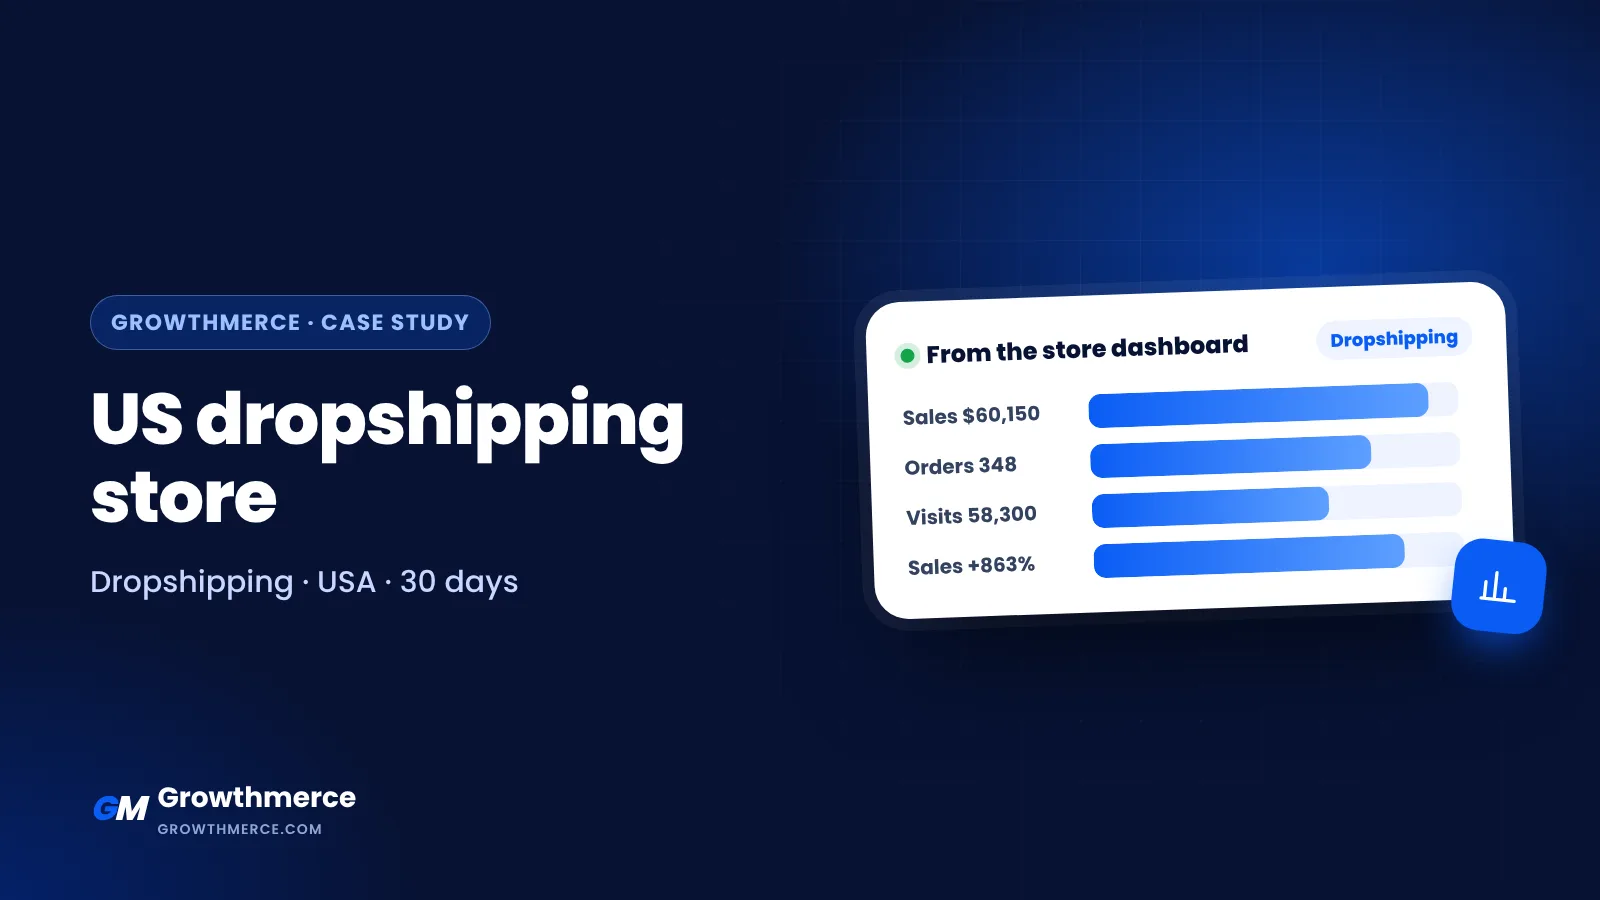
A dropshipping store selling to the United States that did $60,150 in sales from 348 orders in 30 days, with sales up 863% in the dashboard comparison. The average order is about $173.
Where the money comes from
Source: Shopify dashboard, 30 days. Average order and sales per visit are simple divisions of the dashboard numbers.
What these numbers tell us
Four numbers we look at first on any store, and what they mean here.
Average order: $173
Sales divided by orders gives an average order of $173. For this market that leaves healthy room to pay for ads and still make money.
Every visit is worth $1.03
Sales divided by visits shows that each visit to the store brings about $1.03 in sales. This is the number that tells us how much we can afford to pay for a visit.
6 orders per 1,000 visits
Orders divided by visits gives about 6 orders for every 1,000 visits. We use it as a simple, honest read of how well the store turns traffic into orders.
Sales +863%
The store dashboard shows sales +863% in its comparison with the previous period, for 30 days. We show the figure exactly as the dashboard reports it.
How it compares with the other stores we run
We compare every store with the rest of our own portfolio, not with numbers from the internet. The highlighted bar is this store.
This store sells in US dollars to the United States, so we do not put it on the same chart as our Egyptian and Gulf stores. Its numbers stand on their own: $60,150 from 348 orders in 30 days.
How we run a dropshipping store like this
The numbers above come from the store dashboard. This part is how we run dropshipping stores for the US market. Dropshipping is a speed game: find the product, find the angle, prove it with numbers, then scale before everyone else copies it.
Hooks that stop the scroll
US buyers see hundreds of ads a day. The first two seconds decide everything, so we write and test many hooks for the same product before we judge the product itself.
Kill fast, scale faster
Every product gets a fixed test budget and a clear rule. If it does not hit the target cost per purchase, it stops. If it does, budget goes up step by step while we watch the numbers daily.
A store that looks trustworthy
Dropshipping lives or dies on trust. The store needs real product photos, honest shipping times, clear returns and reviews, or the ad money is wasted at checkout.
Order value that covers ad costs
With an average order of about $173, there is room to pay for ads and still make money. We protect that with bundles, quantity offers and post-purchase upsells.
- Quantity and bundle offers
- Post-purchase upsells
- Free shipping threshold
- Daily profit tracking
Three mistakes we see again and again in this category
Most stores in this category do not fail because of the market. They fail because of a few habits that quietly eat the budget.
Keeping a loser alive for weeks burns the budget that should find the next winner.
Doubling budget overnight breaks good campaigns. Steady steps keep the cost stable.
Great ads cannot fix a store that looks unsafe at checkout.
What the first 30 days look like
This is how every new store starts with Growthmerce, before any talk about scaling.
Audit
Store, ads account, tracking and offer reviewed end to end. We write down the baseline numbers.
Fix the leaks
Product pages, checkout and tracking fixed first, because ads only scale what already works.
Test
New creatives, angles and audiences tested with controlled budgets and clear rules.
Scale what won
Budget moves to the winners, and the weekly report shows exactly what changed and why.
The full picture in one table
| Metric | Value | How we got it |
|---|---|---|
| Sales | $60,150 | Total sales in the dashboard period |
| Orders | 348 | Every order placed on the store |
| Visits | 58,300 | Store sessions |
| Average order | $173 | Sales ÷ orders |
| Sales per visit | $1.03 | Sales ÷ visits |
| Orders per 1,000 visits | 6.0 | Orders ÷ visits × 1,000 |
| Sales growth | +863% | Dashboard comparison with the previous period |
Every figure here is copied from the store’s Shopify dashboard, and the averages are simple divisions of those figures. The playbook section describes how we run stores in this category, not a promise of the same result for every store.
Questions people ask about this case
How much did the US dropshipping store sell?
$60,150 in sales from 348 orders and 58,300 visits, for 30 days, as shown in the Shopify dashboard.
Who ran this store?
Growthmerce’s co-founders, Ahmed Raafat and Shaher Rizk, ran the account together with the Growthmerce team.
What is the average order value?
About $173. We get it by dividing total sales by the number of orders.
Why don’t you show the brand name?
Most of our clients prefer to keep their numbers private, so we show the category and market only. The figures themselves are taken directly from the store dashboard.
Can Growthmerce do the same for my store?
Every store starts from a different place, so we never promise a number before we see yours. Book a free call, we review your store and ads together and tell you honestly what we would change first.
How do I start?
Book a call from the button on this page, or look at our packages to see how we work and what is included.


Who ran it
This store was run by Growthmerce’s two co-founders together, with the Growthmerce team behind them. If you want the same people looking at your store, the first step is a free call.